In the iGaming world, your platform’s success depends on turning visitors into loyal players. How? By tracking user behavior metrics – data points that reveal how users interact with your site. These metrics help identify friction points, optimize experiences, and boost conversions.
Here’s what you need to know:
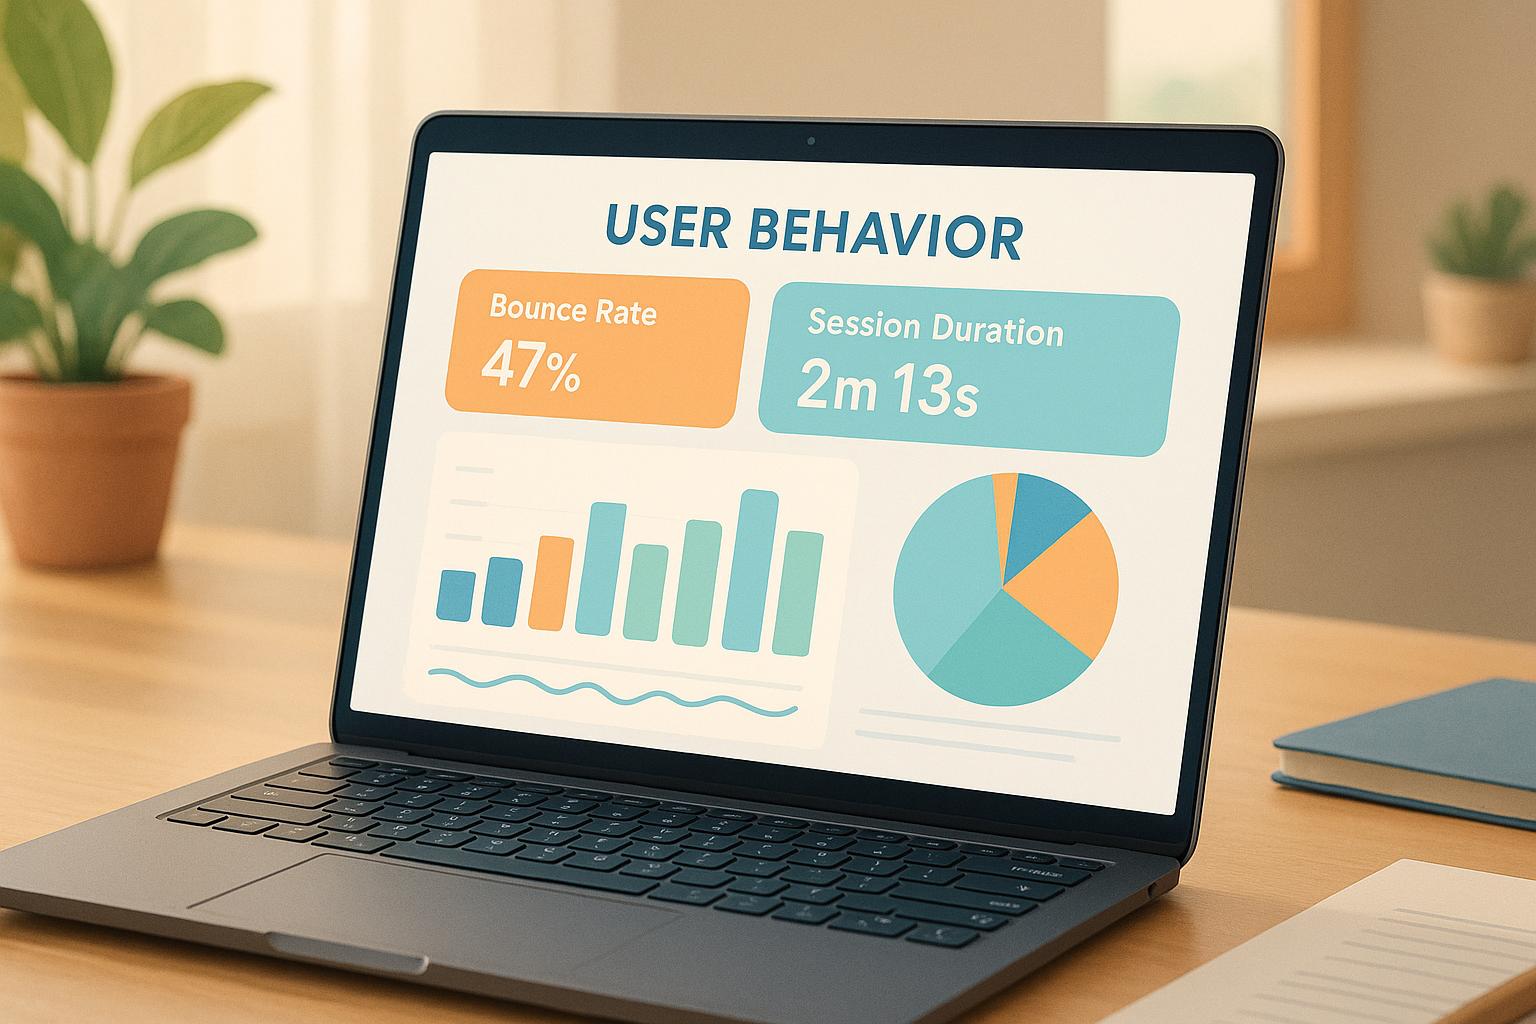
- Bounce Rate: Tracks the percentage of users who leave after viewing one page. High rates may signal poor engagement or technical issues.
- Session Duration: Measures how long users stay on your site. Longer sessions often lead to higher conversions but could also indicate usability issues.
- Click-Through Rate (CTR): Shows how well ads or calls-to-action perform. A low CTR means your messaging may not be resonating.
- Conversion Rate: The ultimate measure of success – how many users complete a desired action, like signing up or making a deposit.
- Retention and Churn Rates: Retention reveals loyalty, while churn highlights why users leave. Both are critical for long-term profitability.
To track these, tools like Google Analytics, Hotjar, and InTarget provide actionable insights. For instance, heatmaps can reveal user navigation patterns, while session recordings highlight where users struggle. Combining these tools helps you refine the user journey, personalize experiences, and improve ROI.
The takeaway? Focus on the metrics that matter most to your goals – whether it’s reducing bounce rates, increasing session durations, or improving retention. With the right data and tools, you can turn insights into meaningful improvements that drive conversions.
Google Analytics 4 Engagement Reports for User Behavior Data
Main User Behavior Metrics That Drive Conversion
Understanding the metrics that reveal user behavior is crucial for driving conversion on your iGaming platform. Below are key metrics that provide insights into user engagement and highlight conversion opportunities.
Bounce Rate
Bounce rate reflects the percentage of visitors who leave your site after viewing only one page. For iGaming platforms, an ideal bounce rate falls between 30% and 45%. A higher rate suggests missed opportunities to engage users.
| Website Type | Average Bounce Rate |
|---|---|
| Ecommerce | 20% – 45% |
| B2B | 25% – 55% |
| Lead Generation | 30% – 55% |
| Landing Pages | 60% – 90% |
| Blogs | 65% – 90% |
| Informational | 35% – 60% |
Traffic sources matter too. For instance, email traffic typically has a bounce rate of around 35%, while display ads hover near 56%.
Technical aspects play a big role in bounce rates. If your page takes over two seconds to load, nearly half of users will leave. Similarly, 73.1% of users abandon sites that aren’t responsive across devices.
“There’s a bit of a misconception here that we’re looking at things like the analytics bounce rate when it comes to ranking websites, and that’s definitely not the case.” – John Mueller, Google
To reduce bounce rates, focus on improving site speed through caching, optimizing images, and minifying JavaScript and CSS. Make sure your site is mobile-friendly with a design that prioritizes usability and provides clear, scannable content that addresses user needs.
Session Duration
Session duration measures how long users spend interacting with your site. A 20% increase in session duration can result in a 15% boost in conversions. On average, sessions last 2–3 minutes across most websites. Longer sessions often indicate higher engagement and conversion potential, though they could also signal that users are struggling to find what they need. To get a full picture, analyze session duration alongside other metrics like conversion rates and user feedback.
To encourage longer sessions, focus on creating relevant, high-quality content and simplifying navigation. Use internal links to guide users deeper into your site, and consider adding interactive elements like quizzes or tools to keep them engaged.
Click-Through Rate (CTR)
Click-through rate measures the percentage of users who click on ads, links, or calls-to-action out of the total who see them. For context, Google ads typically achieve a CTR of 3–5%, while display ads often see just 0.46%. When combined with conversion data, CTR can provide deeper insights into your marketing’s effectiveness.
To improve CTR, focus on crafting compelling headlines, eye-catching visuals, and clear calls-to-action that align with what motivates your audience. Testing different promotional strategies can help pinpoint what resonates best.
Conversion Rate and Click-to-Conversion Rate
Conversion rate tracks the percentage of users who complete a desired action – like signing up, depositing funds, or playing a game – out of the total visitors. While CTR measures initial interest, conversion rate reveals how well your site or campaign turns that interest into action.
| Aspect | Click-Through Rate (CTR) | Conversion Rate (CR) |
|---|---|---|
| Focus | Clicks on ads or links | Completed actions |
| Purpose | Measures ad effectiveness | Assesses campaign/site effectiveness |
| Role in Funnel | Top of funnel (awareness) | Middle/bottom funnel (decision-making) |
| Improvement Areas | Ad copy, targeting | User experience, process simplicity |
To boost conversion rates, ensure your landing pages deliver on the promises made in your ads. Streamline processes and make the user journey as seamless as possible.
Retention Rate and Churn Rate
Retention rate measures the percentage of users who return to your platform over a given period, while churn rate reflects the percentage who stop engaging. These metrics are critical for understanding user loyalty and long-term value – key drivers of sustainable growth in the iGaming industry.
By analyzing churn, you can identify and address the factors causing users to leave. Retention rate analysis helps highlight the behaviors of your most loyal users, allowing you to optimize for similar audiences. High retention often correlates with increased lifetime value.
Effective strategies to improve retention include personalizing content and recommendations based on user behavior, offering loyalty programs that reward consistent engagement, and tackling common issues that lead to churn. Regularly monitoring these metrics creates a feedback loop, enabling continuous improvement in user experience.
Tools for Tracking and Analyzing User Behavior
Using the right analytics tools can provide actionable insights to improve your website’s performance. When implemented effectively, these tools have the potential to increase conversion rates by 15–30% within just three months.
Google Analytics
Google Analytics is a go-to platform for tracking key metrics like bounce rates, session durations, conversion paths, and traffic sources. It’s indispensable for understanding SEO performance and monitoring how users interact with your site. The tool aggregates data such as page views, sessions, and conversion rates, showing you exactly what’s happening on your site.
What sets Google Analytics apart is its ability to integrate with other tools, enabling custom segments and event tracking. For example, you can monitor specific actions like bonus claims, game launches, or deposit completions. This helps you map out the entire user journey – from their first visit to a successful conversion. Additionally, its historical comparisons and trend analysis allow you to detect seasonal patterns, evaluate SEO changes, and see how different user groups engage with your content.
While Google Analytics gives you a solid quantitative foundation, pairing it with tools like Hotjar can provide a deeper understanding of user behavior.
Hotjar
Hotjar offers a more visual approach to analytics, using heatmaps, session recordings, and surveys to reveal how users interact with your site. Heatmaps show where visitors click, scroll, and move their mouse, helping you identify whether players are navigating to key areas like game categories or promotional banners – or if they’re struggling with the registration process.
Session recordings take this a step further by showing real user interactions. For example, you can watch how players engage with bonus pages or navigate through the sign-up process, identifying specific points of friction along the way.
Hotjar also provides flexible pricing options:
| Plan | Price | Sessions | Best For |
|---|---|---|---|
| Basic | Free | 35 daily | Small sites testing the tool |
| Plus | $32/month | 100 daily | Growing iGaming sites |
| Business | $80/month | 500 daily | Established platforms |
| Scale | $171/month | Unlimited | Large operations |
Another standout feature is Hotjar’s survey functionality, which lets you gather direct feedback from users. You can target surveys based on specific behaviors, like asking users who abandoned the registration process why they didn’t complete it or collecting opinions from high-value players about new game features.
InTarget‘s Real-Time Segmentation
For even more precise personalization, InTarget’s Real-Time Segmentation tool delivers actionable data as it happens. This tool identifies player preferences, tracks how users respond to bonuses, and monitors engagement patterns in real time. The real-time nature of this data allows you to adjust content and promotions instantly, boosting conversions without waiting for lengthy post-analysis.
For iGaming SEO, this capability is especially valuable. The tool enables you to create dynamic, adaptive content that keeps your site engaging and relevant. By analyzing behavior at a granular level, you can identify high-value players early in their journey or detect users who might be at risk of leaving. This level of insight ensures that the right message reaches the right player at the right moment.
Choosing the Right Tools
When selecting analytics tools for your iGaming platform, focus on those that offer real-time updates, customizable reports, and mobile optimization. With over 53% of iGaming traffic coming from organic search and more than half of internet traffic being mobile-based, it’s essential to have tools that provide insights across all devices and traffic sources.
The best results come from combining multiple tools. Use Google Analytics for tracking overall performance, Hotjar to uncover user experience challenges, and InTarget for real-time personalization. Together, these tools give you both the big picture and the granular details needed to optimize conversions effectively.
Using User Behavior Data for Conversion Optimization
Analytics tools are a goldmine of information, but the real magic happens when you take that data and turn it into actionable steps to improve conversions. By understanding how users interact with your site, you can fine-tune their experience through journey mapping, personalization, and constant testing.
Mapping the User Journey
Mapping the customer journey helps you see exactly how visitors navigate your site, highlighting any obstacles that might stop them from converting. For instance, in 2024, a staggering 70% of online shoppers abandoned their carts. Knowing when and why users drop off is critical.
Start by setting clear goals and defining buyer personas. For example, on iGaming platforms, personas might include casual gamers seeking fun, high-stakes players looking for exclusive perks, or first-time users exploring their options.
“The customer journey is everything.” – Jimit Mehta, Author
Journey mapping can pinpoint specific problem areas. Imagine a user clicks a Google ad with a “Start a free trial” call-to-action (CTA), but the landing page has a high bounce rate. A heatmap might reveal that visitors focus on the pricing section but ignore the features. This suggests they’re curious about cost but hesitant about what they’re getting. You can use this insight to make the pricing section easier to navigate and better highlight key features.
Keep refining your journey map by analyzing website analytics, gathering customer feedback, and reviewing sales data. Tools like on-page surveys or feedback forms can also uncover valuable ways to improve the user experience.
Personalization Methods
Personalizing your website can make a big difference. In 2024, 93% of companies reported higher conversion rates from personalizing their search engine marketing, while 94% saw boosts from personalizing their websites.
Dynamic personalization is a great place to start. Adjust content based on referral sources, visit times, devices, or even how often a user visits. Campaign Monitor, for instance, saw a 31.4% lift in conversions by tailoring landing page text to match the language used in referral sources. Similarly, The Gladly, a Phoenix-based restaurant, used Duda to promote a Restaurant Week offer with a dynamic banner, which led to a 70% increase in clicks on their “Reserve a Table” button.
Geo-location personalization is another effective strategy. InterContinental Hotels Group (IHG) boosted mobile traffic by 20% by including a click-to-call button in their search ads, with mobile ads contributing 40% of their global mobile marketing revenue.
Personalized CTAs can perform 212% better than generic ones, but there’s a fine line between helpful and invasive. Start with simple tweaks and gradually use data science to predict customer needs.
“You should view personalization as a method for delivering relevant experiences, rather than a conversion gimmick.” – Shane Barker
A/B Testing and Continuous Improvement
A/B testing takes the guesswork out of optimization. It’s a methodical way to test changes, measure their impact, and steadily improve your site’s performance.
Before starting, define your goals. Test one variable at a time – whether it’s a headline, a button color, or a layout – and run the test long enough to gather reliable data. For example, the National Association of Boards of Pharmacy (NABP) tested different homepage banners. One version achieved a conversion rate of over 3%, while the alternative lagged behind at less than 1%.
Even small changes can yield big results. Performable saw a 21% boost in conversions by simply switching a button from green to red.
“If you aren’t testing, you don’t know how effective your changes are. You might have correlation but no causation.” – Kyle Rush, VP of Engineering at Casper
Adopt a continuous testing mindset. Regularly monitor your site’s performance, run frequent A/B tests, and use analytics tools to dive deeper into user behavior. Segmenting users during tests can uncover additional opportunities for personalization and further improve conversions.
Key Metrics Comparison Table
Understanding your site’s performance requires a solid grasp of key metrics. Each metric offers unique insights, and knowing their strengths and limitations helps you choose the right tools for analysis. Here’s a breakdown of critical user behavior metrics:
| Metric | Primary Advantage | Key Limitation | Best Use Case |
|---|---|---|---|
| Bounce Rate | Quick indicator of content relevance and user experience issues | High bounce rates don’t always mean poor performance | Spotting pages that need attention, especially when paired with other metrics |
| Session Duration | Measures content engagement and user interest | – | Assessing content effectiveness and user satisfaction |
| Click-Through Rate (CTR) | Directly evaluates marketing campaign performance | – | Refining ad copy, email campaigns, and call-to-action buttons |
| Conversion Rate | Tracks business success and revenue impact | – | Measuring marketing ROI and campaign outcomes |
| Retention Rate | Highlights long-term customer satisfaction and value | – | Developing loyalty programs and lowering customer acquisition costs |
| Churn Rate | Identifies dissatisfied customers | – | Detecting at-risk users and improving retention strategies |
Bounce Rate Benchmarks
Bounce rate benchmarks help gauge site performance. A bounce rate of 26%–40% is excellent, while 41%–55% is average. If your rate hits 56%–70%, it’s worth investigating further. For blogs or news sites, a bounce rate above 70% is often normal since users tend to find what they need on a single page.
Session Duration Insights
Segmenting session duration by user type and content category can reveal engagement patterns. For example, in the iGaming industry:
- Under 2 minutes: Users may be dropping off quickly, signaling the need for simpler steps or more engaging content.
- 2–5 minutes: Indicates exploration without strong engagement.
- Over 5 minutes: Suggests high engagement and readiness for actions like deposits.
“What gets measured gets managed.” – Peter Drucker
CTR and Conversion Rate Dynamics
Click-through rates (CTR) are a great way to measure immediate interest. For instance, a high CTR paired with a low conversion rate suggests a disconnect between ad promises and landing page experience.
Conversion rates, on the other hand, provide a direct measure of business impact. In iGaming, a strong activation rate typically falls between 40% and 60%. A drop in conversion rates may indicate issues that require further investigation into related metrics.
Combining Metrics for Deeper Insights
Metrics are most powerful when used together. For instance:
- Pairing bounce rate with session duration helps determine if users find what they need quickly or leave without deeper engagement.
- Reviewing CTR alongside conversion rate reveals whether your traffic quality aligns with business goals.
Prioritizing Metrics for Specific Goals
Your focus will depend on your objectives:
- To enhance engagement, concentrate on session duration, active user counts, and feature usage .
- To reduce churn, monitor churn rate, customer health scores, and retention metrics .
- To improve conversion rates, keep a close eye on conversion rates, CTR, and landing page performance .
Interestingly, over a third of marketers (34.2%) rarely or never measure their marketing ROI. Avoid this by aligning metrics with your goals and tracking them consistently. This approach helps uncover trends and patterns that drive meaningful improvements.
Conclusion
Turn user behavior data into actionable strategies that drive conversions. With the iGaming industry forecasted to hit $100.90 billion in revenue by 2024 and grow at a 12.01% CAGR from 2025 to 2034, success hinges on applying insights strategically – not just collecting data.
The metrics comparison table highlights how each measurement plays a role in optimizing conversions. For instance, lower bounce rates and longer session durations signal better engagement. Pair these insights with personalization efforts and solid technical SEO practices for the best results.
Data-driven strategies deliver measurable outcomes. Take these examples: a betting site that emphasized “fast payouts” in its content saw a 20% boost in user retention, while a casino app’s VIP segmentation strategy increased revenue from high-value players by 15%. These cases illustrate the power of focused metric analysis.
Here are some key takeaways to keep in mind:
- Mobile optimization is crucial. With the industry projected to reach 281.3 million users by 2029, a seamless mobile experience is non-negotiable. Responsive design, quick load times, and touch-friendly features are essential for keeping users engaged.
- Personalization enhances engagement. Leverage AI to analyze player behavior and deliver tailored content or game recommendations. Targeted efforts like these often outperform generic campaigns.
- Technical SEO lays the foundation. Ensuring search engines can effectively crawl and index your site is vital. Use schema markup, XML sitemaps, and a well-structured site to support organic growth.
- Content quality drives results. On one platform, video tutorials generated twice the revenue of blog posts, prompting a shift toward video content. Monitor content performance to identify the formats that deliver the highest ROI.
- Adapt to local SEO needs. Regulations and preferences vary by region. For example, Bandai Namco Europe‘s location-specific redirects improved global engagement by delivering regionally relevant content.
- Monitor metrics regularly. Consistent tracking of key data points helps you spot trends and refine strategies as user behavior evolves.
The rapid expansion of the iGaming market offers significant opportunities for those who truly understand their audience. By implementing these proven strategies, you can build a conversion-focused approach that evolves with changing user behaviors and market dynamics.
FAQs
What are the best ways to lower the bounce rate on my iGaming website and boost user engagement?
To reduce the bounce rate on your iGaming website and keep users engaged, focus on crafting a smooth and enjoyable experience for visitors. Start by speeding up page load times, making sure your site is fully optimized for mobile devices, and incorporating clear, attention-grabbing calls-to-action that guide users effortlessly.
Take it a step further by enhancing your landing pages with dynamic content, like videos or interactive features, to grab attention right away. Regularly review user behavior to pinpoint where visitors are dropping off, then tweak your content or design to align better with their preferences. By aligning your site with what your audience wants, you’ll not only lower bounce rates but also encourage visitors to stick around longer.
How can I increase session duration while keeping users engaged?
To increase session duration while keeping users happy, aim to create a smooth and enjoyable experience. Begin with a website design that’s easy to navigate and make sure pages load quickly. Offering high-quality, regularly refreshed content that matches what your audience is looking for can also keep them engaged.
Adding interactive features, like videos, quizzes, or tailored recommendations, can make the time spent on your site more enjoyable. You can also use subtle visual elements, such as progress bars or animations during loading screens, to reassure visitors and make wait times feel shorter. These small tweaks can go a long way in improving user satisfaction and encouraging them to stick around.
What are the best analytics tools to track user behavior and boost conversion rates in the iGaming industry?
To better understand user behavior and boost conversions in the iGaming industry, it’s essential to pick analytics tools that deliver real-time data, event tracking, and insights tailored to gaming metrics. For instance, Google Analytics 4 (GA4) offers powerful tracking capabilities, while tools like Hotjar, which include heatmaps and user journey analysis, give you a clearer picture of how players interact with your platform.
Prioritize platforms with customizable dashboards, seamless integration with gaming systems, and adherence to local data privacy laws. These features make it easier to track key metrics like bounce rates, session lengths, and click-through rates, enabling you to refine your strategies and improve player engagement effectively.